Why Pronto Xi, Cognos, Phocas and Excel Reports Don’t Match
A practical diagnostic guide to definitions, timing, filters, data grain, mappings and reconciliation
Why do Pronto Xi, Cognos, Phocas and Excel sometimes show different numbers?
Different reports can show different numbers even when they ultimately originate from Pronto Xi because they may use different business definitions, dates, refresh times, filters, security rules, data grain, mappings, calculations or transformations.
The first question should not be:
Which report is wrong?
It should be:
Are these reports actually measuring the same thing, from the same population, at the same point in time and at the same level of detail?
This matters because reporting disagreement can undermine the return on significant ERP and analytics investment.
An organisation may invest in Pronto Xi, IBM Cognos Analytics, Phocas, data warehouses and reporting resources, yet still have managers spending hours reconciling spreadsheets before they trust the numbers.
Pronto positions Xi as an integrated ERP with IBM Cognos-powered business intelligence, while Pronto iQ can create data warehouses, specialised data models and BI cubes from Pronto Xi and other business data.
Phocas likewise supports dashboards, filtering, drill-down and analysis across multiple databases and data sources.
Those capabilities are useful precisely because they can transform and interpret raw transactions.
But they also mean:
Same underlying ERP does not automatically mean same reporting logic.
The goal is therefore not to force every report to display the same number.
It is to ensure that every material number is defined, traceable and explainable.
Should every report actually match?
No.
Two reports may legitimately differ because they answer different business questions.
For example, September Revenue might mean:
-
invoices dated in September;
-
transactions posted in September;
-
goods shipped during September;
-
sales orders entered in September;
-
recognised accounting revenue;
-
net sales after credits;
-
sales excluding internal customers;
-
revenue translated into AUD using a particular exchange rate.
Every report might be labelled Revenue.
Only one may actually be erroneous.
The others may simply be measuring different things.
This is why reconciliation should begin with business meaning, not database troubleshooting.
The eight-step reporting diagnostic
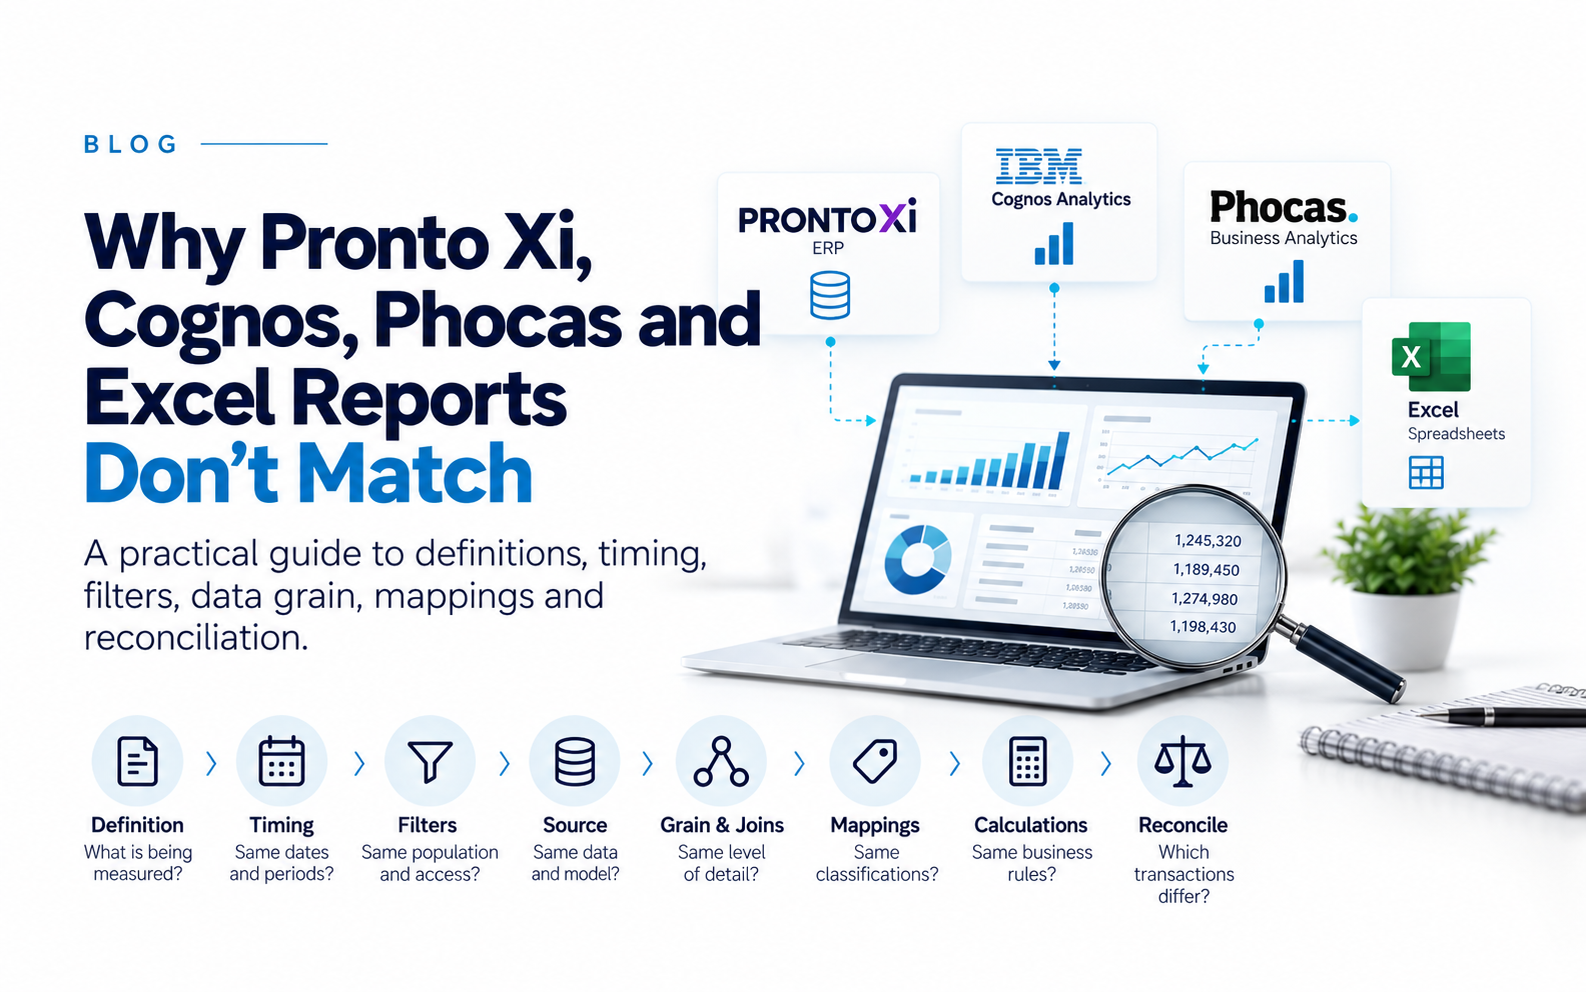
When Pronto Xi, Cognos, Phocas or Excel disagree, investigate them in this order:
-
Definition
-
Timing and fiscal period
-
Filters, security and population
-
Source and reporting layer
-
Data grain and joins
-
Mappings and master-data history
-
Transformations and calculations
-
Transaction-level reconciliation
This sequence saves time.
There is little value investigating ETL code if one report uses invoice date and the other uses posting date.
1. Do the reports use the same business definition?
Start by defining the metric in plain English.
Do not accept:
Gross Margin
as a complete definition.
Instead document something such as:
Gross margin = net posted invoice sales excluding GST and internal transactions, less recognised cost of goods sold.
Do the same for:
-
revenue;
-
sales;
-
gross margin;
-
EBITDA;
-
stock on hand;
-
inventory value;
-
order intake;
-
purchasing spend;
-
customer profitability;
-
debtor days;
-
DIFOT; and
-
headcount.
A simple KPI definition record could contain:
| Field | Example |
|---|---|
| KPI | Revenue |
| Business owner | CFO |
| Transaction basis | Posted invoice |
| Date basis | Invoice date |
| Entities | Australian companies |
| Internal transactions | Excluded |
| Credits | Included |
| Currency | AUD |
| Refresh expectation | Daily |
If two reports intentionally apply different definitions, rename them rather than forcing them to reconcile.
For example:
Invoiced Revenue
and
Revenue Recognised
are clearer than two conflicting reports both labelled Revenue.
2. Are timing and fiscal periods aligned?
Timing is one of the simplest causes of apparently inconsistent reporting.
Imagine:
-
Pronto Xi is queried at 2:00 pm;
-
Cognos runs at 2:30 pm;
-
Phocas was refreshed overnight;
-
Excel contains yesterday's export.
The four reports may all be working correctly.
Pronto iQ publishes support for data synchronisation, data warehouses and specialised reporting models, while Phocas allows analysis by configurable periods and date ranges.
Check:
-
last refresh time;
-
transaction cut-off;
-
timezone;
-
backdated transactions;
-
invoice date;
-
posting date;
-
order date;
-
shipment date;
-
financial period;
-
calendar month;
-
4-4-5 or other fiscal calendars.
The word “September” is not a definition
One report might mean:
1–30 September by invoice date
while another means:
Pronto Financial Period 9 by posting date.
Those are different populations.
For every material report, state the date rule explicitly.
3. Are filters, security and populations identical?
Filters can alter the number without being obvious to the user.
IBM Cognos supports filters at different stages of a query, including detail and summary filtering.
Phocas similarly allows users to filter dashboards and analysis by dimensions, periods and other selections.
Excel may contain another layer of:
-
PivotTable filters;
-
slicers;
-
hidden rows;
-
formulas;
-
manually removed records.
Compare filters for:
-
company;
-
branch;
-
warehouse;
-
customer;
-
product;
-
salesperson;
-
transaction status;
-
internal customers;
-
credits;
-
cancelled records;
-
currency;
-
business unit;
-
period.
Do not overlook security
Two people can open apparently identical BI reports and still see different totals if their security permissions differ.
Check:
-
entity access;
-
branch restrictions;
-
row-level security;
-
user-specific data entitlements.
Before comparing two screenshots, ask:
Were both reports run by users with equivalent access to the underlying data?
4. Are the reports using the same source and reporting layer?
“Both come from Pronto” is not sufficiently precise.
A number may come from:
Pronto Xi transaction data
or
Pronto Xi operational reporting
or
Cognos reporting model
or
Pronto iQ data warehouse
or
BI cube
or
Phocas analytical dataset
or
Excel export
Pronto iQ explicitly describes optimising raw Pronto Xi transactions through specialised data models, warehouses and BI cubes, and notes that those cubes can contain calculations and consolidate relevant data for analysis.
That is not a weakness.
It is the purpose of an analytical layer.
But CFOs and CIOs should be able to trace an important KPI through its lineage.
An illustrative architecture might be:
Pronto Xi
↘ Cognos model/report
and separately:
Pronto Xi → extraction/data warehouse → Phocas
while:
Cognos or Phocas → Excel
may create another downstream layer.
The architecture varies by organisation.
The control question is:
Can we explain the actual route this number took from transaction to executive report?
5. Are the reports using the same data grain and joins?
This is one of the most important technical checks.
Data grain means the level at which the data is represented.
For example:
-
one row per invoice;
-
one row per invoice line;
-
one row per customer per month;
-
one row per product per warehouse.
Two reports can use identical definitions and filters and still disagree if one aggregates at invoice level and another at invoice-line level.
Why joins matter
Suppose one invoice has:
-
three product classifications; and
-
two customer-mapping records.
A badly designed join can unintentionally turn one transaction into multiple analytical rows.
The totals can be overstated without an obvious software error.
Useful checks include:
-
source row count;
-
report row count;
-
unique invoice count;
-
unique order count;
-
unique transaction ID count.
Ask:
Does the number of unique business transactions still agree after the data passes through the reporting model?
If not, investigate joins before investigating accounting.
6. Are mappings and master-data history consistent?
Sometimes total sales agree but sales by region, product group or salesperson do not.
That usually points to classification.
Common mappings include:
-
branch;
-
territory;
-
salesperson;
-
customer segment;
-
product category;
-
cost centre;
-
GL hierarchy;
-
business unit.
Historical classification matters
Suppose a customer moves from NSW to Queensland in September.
Should January sales now appear under Queensland because that is the customer's current territory?
Or should January remain under NSW because that was the classification when the transaction occurred?
Both approaches are possible.
But the organisation must choose.
This principle affects:
-
sales territories;
-
product categories;
-
customer segmentation;
-
sales representatives;
-
organisational hierarchies.
If one reporting model uses current master data while another preserves historical classification, the analysis will differ even when the underlying transactions match.
That is a data-governance decision, not necessarily a report defect.
7. Are transformations and calculations identical?
Once data leaves the transactional layer, calculations can substantially change it.
Cognos supports calculated data items and reusable calculations within its modelling and reporting environment.
Phocas provides filtering, calculation and analytical functionality and allows users to move from summary results into transaction detail.
Excel can add virtually unlimited downstream logic.
Review:
-
exchange rates;
-
rounding;
-
rebates;
-
discounts;
-
credits;
-
standard versus actual costs;
-
landed costs;
-
allocations;
-
tax treatment;
-
unit conversion;
-
derived KPIs;
-
manual adjustments.
Currency deserves particular attention
Two reports may contain exactly the same transactions but use different exchange-rate logic.
For example:
-
transaction currency;
-
functional currency;
-
invoice-date rate;
-
posting-date rate;
-
month-end rate;
-
average monthly rate.
For international organisations, this alone can create material differences.
Example: “Gross Margin”
Report A:
Net Sales – Standard Cost
Report B:
Net Sales – Actual COGS
Report C:
Net Sales – Actual COGS – Rebates
All may be described as gross margin.
They are not the same metric.
8. Reconcile at transaction level
Only after the earlier checks should you descend to individual transactions.
Suppose:
Cognos: $12.45 million
Phocas: $12.31 million
The variance is $140,000.
That tells you almost nothing.
Compare transaction identifiers such as:
-
invoice number;
-
order number;
-
journal number;
-
customer;
-
item;
-
transaction date;
-
posting date;
-
value;
-
status;
-
branch;
-
entity.
Divide the variance into:
Records present in both
Records only in report A
Records only in report B
Records present in both but calculated differently
The result may become:
-
$82,000 — transactions after the Phocas refresh;
-
$34,000 — customer class excluded by Cognos;
-
$16,000 — different exchange-rate treatment;
-
$8,000 — duplicated rows caused by a join.
Now the problem is actionable.
Use reconciliation tolerances intelligently
Not every reporting variance requires investigation.
Define tolerances by metric.
| Measure | Possible tolerance approach |
|---|---|
| Posted GL balance | Zero unexplained difference |
| AR control account | Zero unexplained difference |
| Statutory reporting | Zero/materially zero |
| Operational sales dashboard | Timing tolerance may be acceptable |
| Rounded executive KPI | Small rounding tolerance |
| Intraday inventory | Defined timing tolerance |
The tolerance should reflect the decision being made.
A $500 timing difference may be irrelevant to an hourly sales dashboard and unacceptable in a month-end control account.
Classify the type of reporting problem
Not every mismatch is a “report problem”.
Classify the issue first:
1. Source-data defect
The transaction itself is incorrect.
Examples:
-
wrong customer;
-
wrong cost;
-
incorrect date;
-
bad master data.
2. Integration defect
The transaction did not move correctly between systems.
Examples:
-
missing record;
-
duplicate;
-
failed interface;
-
stale extract.
3. Data-model defect
The analytical model changes the number incorrectly.
Examples:
-
duplicated join;
-
incorrect mapping;
-
wrong grain.
4. Report defect
The underlying model is right but the report logic is wrong.
Examples:
-
bad filter;
-
wrong formula;
-
incorrect period.
5. Interpretation problem
The report is correct but users assume it means something different.
Examples:
-
“sales” interpreted as orders rather than invoices;
-
historical region confused with current region.
This classification helps assign the issue to the correct owner.
One-page report dispute protocol
When executives say:
“These reports don't match.”
use this sequence.
| Step | Question | Primary owner |
|---|---|---|
| 1. Definition | Are we measuring the same business concept? | Finance / business owner |
| 2. Timing | Are dates, periods and refresh times aligned? | Finance + BI |
| 3. Population | Are filters, entities and security identical? | Report owner |
| 4. Source | What system/model generated each number? | ERP / BI |
| 5. Grain | Is the unit of analysis identical? | Data / BI |
| 6. Joins | Have transactions been duplicated or dropped? | Data / BI |
| 7. Mapping | Are dimensions and historical classifications aligned? | Business + data owner |
| 8. Calculations | Are currency, cost and KPI formulas identical? | Finance + BI |
| 9. Tolerance | Is the remaining variance material? | Business owner |
| 10. Transactions | Which records explain the remaining difference? | Finance + IT / BI |
This protocol can prevent hours of unstructured investigation.
Why can Pronto Xi and Cognos show different numbers?
Pronto Xi and Cognos are closely integrated, but a Cognos report can still apply analytical logic that differs from a live operational enquiry.
Pronto describes Cognos Analytics as deeply integrated with Xi and capable of on-demand and scheduled reporting, dashboards and analytics.
Cognos may also involve:
-
reporting models;
-
filters;
-
calculations;
-
aggregation;
-
security;
-
warehouses;
-
BI cubes.
The right question is:
Which model, filters and calculations generated this Cognos number?
Not simply:
“Did it come from Pronto?”
Why can Phocas and Pronto Xi show different numbers?
Phocas is designed to analyse and visualise data from ERP and other sources and allows filtering and drilling through analytical datasets.
A Phocas dataset may have:
-
a separate refresh cycle;
-
transformed source data;
-
its own dimensional hierarchies;
-
calculated measures;
-
multiple source systems;
-
user-specific filters.
The particularly important question is:
Does the Phocas analytical hierarchy classify transactions the same way as Pronto Xi currently does?
A customer, product or territory may legitimately be classified differently if historical and current master-data rules differ.
Why does Excel create additional risk?
Excel remains extremely valuable.
It is often the right tool for:
-
modelling;
-
scenarios;
-
commentary;
-
ad hoc analysis;
-
presentation.
The risk begins when it becomes an undocumented transformation layer.
Consider:
Pronto Xi → BI report → Excel export → VLOOKUP/XLOOKUP → manual adjustment → executive pack
The final number may now depend on:
-
workbook version;
-
formula integrity;
-
mapping tables;
-
hidden cells;
-
pasted data;
-
manual overrides;
-
one employee's knowledge.
The correct question is not:
“Should we ban Excel?”
It is:
“Can we explain what happens to the data after it leaves the governed reporting environment?”
Which number should the CFO trust?
There is no single universal “source of truth”.
Instead, define an authoritative source for each business concept.
| Metric | Likely authority |
|---|---|
| Posted GL balance | Pronto Xi GL |
| Customer receivable | Relevant Pronto Xi AR records |
| Inventory quantity | Governed Pronto inventory process |
| Management gross-margin KPI | Approved analytical model |
| Budget | Approved planning/budgeting model |
| Customer segment | Governed customer master / analytical definition |
The important distinction is:
System of record
versus
system of analysis
Pronto Xi may own the transaction.
Cognos or Phocas may legitimately own a derived management KPI.
The governance requirement is that the analytical measure can be traced back to its transactional foundation.
Build a KPI dictionary before building another dashboard
One of the highest-ROI improvements may require no new technology.
Create a governed KPI dictionary containing:
-
metric;
-
definition;
-
owner;
-
source;
-
date basis;
-
grain;
-
filters;
-
mappings;
-
calculation;
-
currency treatment;
-
refresh frequency;
-
tolerance;
-
reports using it.
For example:
Gross Margin %
Owner: CFO
Source: Governed sales analytical model
Grain: Invoice line
Date: Invoice date
Internal customers: Excluded
Credits: Included
Cost: Actual recognised COGS
Currency: AUD using transaction accounting rate
Refresh: Daily
When another dashboard needs Gross Margin %, it should reuse the governed definition rather than invent a fourth version.
Do not solve disagreement by creating another report
A common reporting anti-pattern looks like this:
Cognos and Excel disagree.
Someone builds a new Cognos report.
Phocas then shows another number.
Someone creates another dashboard.
Finance still does not trust the result, so another spreadsheet is built.
The organisation ends up with:
More reports. Less agreement.
A better model is:
One governed definition → controlled data logic → multiple useful presentations
You do not necessarily need one reporting tool.
You need one governed interpretation of each critical metric.
A stronger reporting architecture
A mature model might separate four layers.
Layer 1 — Transaction systems
Pronto Xi and other applications own operational transactions.
Layer 2 — Data integration and modelling
Controlled extraction, transformation, warehouse and cube structures prepare data for analysis.
Pronto iQ explicitly provides data warehousing, data models and BI cubes that can combine and optimise Pronto Xi data for analytical use.
Layer 3 — Analytics
Cognos, Phocas or other BI tools provide analysis, drill-down and dashboards.
Layer 4 — Presentation and modelling
Excel and presentation tools support modelling, commentary and communication where appropriate.
The key governance principle is:
Move reusable business logic as far upstream as practical.
If twenty spreadsheets independently calculate gross margin, governance becomes difficult.
If gross margin is governed once, twenty reports can reuse the same definition.
Who should own reconciliation?
Reporting trust cannot belong to IT alone.
| Question | Appropriate owner |
|---|---|
| What does revenue mean? | CFO / business owner |
| What is the accounting treatment? | Finance |
| Is the source transaction correct? | ERP functional owner |
| Did extraction work correctly? | IT / integration |
| Is the model grain correct? | BI / data |
| Are mappings valid? | Business + data owner |
| Is Cognos logic correct? | Cognos / BI owner |
| Is Phocas logic correct? | Analytics owner |
| Has Excel altered the number? | Workbook/report owner |
| Who approves the KPI? | Named business owner |
IT cannot decide whether a rebate belongs in management revenue.
Finance cannot necessarily diagnose a many-to-many database join.
Trusted reporting requires shared ownership.
How does reporting governance improve ROI from Pronto Xi?
Pronto positions Xi around integrated information, Cognos-powered reporting and a centralised view of business data.
The value of that investment is reduced when managers spend time reconciling competing reports.
Stronger governance can contribute to:
-
less manual reconciliation;
-
fewer duplicate reports;
-
reduced spreadsheet dependency;
-
faster management reporting;
-
greater KPI trust;
-
quicker root-cause analysis;
-
improved self-service;
-
fewer low-value reporting requests to IT.
The ROI question is therefore not:
“How many dashboards have we built?”
It is:
“How quickly can managers obtain a number they understand and trust enough to act on?”
A practical 30-day improvement program
Start with the five KPIs that create the most disagreement.
Week 1 — Define
Document:
-
definition;
-
owner;
-
date basis;
-
grain;
-
filters;
-
currency;
-
tolerance.
Week 2 — Trace
Map the actual lineage.
For example:
Pronto Xi → data warehouse → Phocas
and:
Pronto Xi → Cognos
and:
Cognos → Excel management pack
Week 3 — Reconcile
Classify each variance as:
-
definition;
-
timing;
-
filter;
-
security;
-
grain;
-
duplicate join;
-
mapping;
-
calculation;
-
currency;
-
missing data;
-
manual adjustment;
-
source defect.
Week 4 — Govern
Agree:
-
authoritative definition;
-
analytical model;
-
owner;
-
refresh frequency;
-
tolerances;
-
approved reports;
-
change-control process.
Then retire duplicate reporting where practical.
Reporting mismatch checklist
When two reports disagree, ask:
-
Are they measuring the same business concept?
-
Are the dates and fiscal periods identical?
-
Were the datasets refreshed at comparable times?
-
Are entity and transaction filters identical?
-
Do users have equivalent security access?
-
Is the source/reporting layer the same?
-
Is the underlying data grain identical?
-
Are joins duplicating or dropping records?
-
Are master-data mappings consistent?
-
Is historical classification handled consistently?
-
Are currencies converted using the same rules?
-
Are credits, rebates and costs treated identically?
-
Has Excel introduced formulas or manual adjustments?
-
Is the remaining difference within an agreed tolerance?
-
Can any material residual variance be explained transaction by transaction?
If these questions cannot be answered, the organisation likely has a data-governance and lineage problem rather than merely a reporting problem.
Where SAAPRO fits
Reporting problems can expose capability gaps as much as technology gaps.
Resolving them may require people who understand the interaction between Pronto Xi transactions, finance processes, Cognos, reporting models and business requirements.
SAAPRO specialises in the Australian Pronto Xi market and can help organisations identify Business Analysts, Financials specialists, Cognos resources, Systems Analysts and ERP Managers whose experience matches the underlying problem rather than simply matching an ERP keyword.
Disclosure: SAAPRO is an independent Pronto Xi recruitment specialist and is not Pronto Software, IBM or Phocas Software.
This article provides an independent reporting and data-governance framework. Product references are based on current official Pronto Software, IBM and Phocas information. Actual reporting architecture, data flows, models and refresh schedules depend on each organisation's version, configuration and integrations.
Frequently Asked Questions
Because they may use different business definitions, dates, filters, refresh times, data grains, mappings or calculations. Before deciding that one is wrong, confirm that both reports are intended to measure exactly the same metric.
Cognos may use reporting models, filters, calculations, aggregation rules, security or transformed data that differ from a live Pronto Xi enquiry. Start with the metric definition, date basis, source model and refresh timing.
Phocas may analyse an extracted or transformed dataset with its own refresh cycle, mappings, periods, filters and dimensions. Check data freshness, analytical hierarchy and transaction-level lineage before assuming the result is incorrect.
Excel may contain an older extract, PivotTable filters, formulas, mapping tables or manual adjustments. Compare the raw input dataset before comparing the final formatted workbook.
The one based on the organisation's approved definition and authoritative data source for that metric. A posted GL balance may be governed directly in Pronto Xi, while a derived management KPI may legitimately be governed in a controlled analytical model.
Only where the dashboards claim to represent exactly the same metric, population, period and calculation. Different business measures should be clearly labelled rather than artificially forced to agree.
Key Takeaways
- ✓Before asking "which report is wrong," ask whether the reports are actually measuring the same thing, at the same time, at the same level of detail.
- ✓Work through the diagnostic in order, definition, timing, filters, source, grain, mappings, calculations, before reconciling at transaction level.
- ✓Not every mismatch is a report defect, classify it as a source, integration, data-model, report, or interpretation problem to route it to the right owner.
- ✓Build a governed KPI dictionary so every dashboard reuses one definition instead of each report inventing its own version.